Brand Scoreboard — Bento · Gà Nướng · Cơm Sườn side by side
AI ▼
GMV & Disc % from the monthly close (Sites) · Dishes sold, Avg price, Attach & Menu size from order line items · Menu size = dishes that sold at least once, and how many of them sell <1/day · MoM = GMV vs previous month
AI ▼
Brand GMV Trend — last 6 months
Brand × City — where each brand earns, both cities
Basket pull — when this dish is in the order, how big is the order? ·
AI ▼
Dish margin — estimated · BOM quantities × latest purchase prices · variable cost only (no labour/rent) ·
AI ▼
Cut candidates — real dishes selling <1/day · worst first · sauces, drinks & add-ons excluded
AI ▼
Pitch Deck
Company Introduction · July 2026 · 23 outlets · live from Financial data
1 / 15
Use ← → arrow keys to navigate · rebuilt from the July 2026 investor deck, brand-matched and wired to live data
P&L
P&L snapshot · from the monthly close ·
Month
AI ▼📊 Market context — how these margins read against the industry · Jul 2026 research▼
Commission — % of GMV
Market25–30%
Cooky10.6%
A margin edge rivals don't have · EBITDA-positive is rare in the culling — the streak is an asset.
Market to 2030
2025$2.1B
2030 fcst$9B
Semi-fixed kitchen + HQ = the operating-leverage story investors buy.
Industry cost squeeze
45% of F&B has ingredients >30% of selling price · ~49% plan price hikes
was 20.4% — every 1pt back ≈ ₫106M/mo straight to EBITDA
Biggest risk
~68% GMV on Shopee
2/3 of the business on one app — market gives Shopee only 48%
Cooky~68%
Market48%
Edge to protect
10.6% commission / GMV
market pays 25–30% — understand why before investors ask
Cooky10.6%
Market25–30%
Bottom line: Cooky is gaining share in a $2.1B market that doubles by 2030 — but growth is partly bought with discounts and rides on one app. Fix discount discipline & channel concentration (directions 1–2) before scaling stores.
Vietnam's food delivery market — size & structure
Size & growth — still doubles by 2030
2024$1.8B
2025$2.1B+19% YoY
2030 forecast$9Bincl. ride-hailing
🚪Consolidated to a duopoly: Baemin & Gojek exited; only newcomer is Xanh SM Ngon at 17–20% commission (no meaningful sales yet).
📉Overall F&B is flat ("second wave of culling") — growth must be taken from competitors, not from the tide.
🍚User behavior differs by app: GrabFood users order full rice meals; ShopeeFood skews milk tea & snacks — Cooky's core category indexes to Grab, where it is weakest.
Platform market share 2025 (nationwide)
ShopeeFood48%
GrabFood48%
beFood4%
Xanh SM Ngon<1%
Hanoi: Shopee leads (56%) · HCMC: Grab leads (~50%) · early 2026: Grab overtook Shopee nationwide for the first time.
Where does Cooky sit in the channel picture? — GMV mix Jun 2026 (from report) vs platform market share
Problem child — sliding despite the deepest promos.
Cơm Sườn · HN
$72.2K ₫1.88B
+38%
35.0%
20%
Category leader — +75% since Aug'25, but growth is bought at 35% discount.
Gà Nướng · HN
$4.8K ₫126M
+1%
22.9%
78%
Still small (~₫126M/mo) vs HCM's ₫2.0B — the evening daypart is Hanoi's open headroom.
Attach = toppings per main dish. HCM attaches at 87%, Hanoi at ~21% — the single biggest like-for-like upsell gap in the network.
Hero SKUs — top dishes network-wide, Jun 2026 item sales
Cơm Gà Mắm TỏiHCM · ₫40K₫705M17.5K sold
Ăn Ngon Rẻ Xối Mắm TỏiHN · ₫28K₫325M11.4K sold
Cơm Tấm Sườn NướngHN · ₫33K₫278M8.6K sold
Gà Nướng Nguyên ConHCM · ₫166K₫275M1.7K sold
Cơm Gà Mắm Tỏi Đùi LớnHCM · ₫74K₫265M3.6K sold
🎯Focused menu works: top-10 dishes = 40% of item sales (HCM 52%) — concentration is a strength for kitchen ops.
⚠️Flagship watch: Cơm Gà Mắm Tỏi HCM −8% units MoM — the #1 SKU dipping deserves a root-cause before promos.
🏷️"Ăn Ngon Rẻ" budget line (HN only): 21K units · ₫585M at ~₫27–28K — the sub-30k answer, but it anchors Hanoi's 32–35% discount habit.
🧹Long tail: 205 SKUs sell <1/day = 2.7% of sales, many are POS name duplicates — clean before adding anything new.
💰Data gap: no cost-per-dish yet — all rankings are volume-based, not margin-based.
SKU strategy — what to push, fix, and develop (internal trend × market research Jul 2026)
🚀 Push
Gà Nướng HCM — whole-bird combos+47% in 6 months at the network's lowest discount; ticket ₫166–374K; no chain owns grilled whole-bird delivery (rivals = small franchises + fried-chicken QSR). Push on Grab — its users buy full meals, and Grab holds ~50% of HCMC.every +10% ≈ +₫200M/mo
Cơm Tấm Sườn HNCategory leader in a city with few com tam specialists — hold volume while walking discount 35% → 30%.−5pt disc ≈ +₫94M/mo
Topping attach in Hanoi21% vs HCM's 87%: default sides into combos (canh, dưa chua) the way HCM menus do.+10pt ≈ +₫80M/mo
🔧 Fix
Bento HN — losing to Anh Nguyễn−25% since Jan while Cơm Thố Anh Nguyễn (120–140 stores, ₫35–50K, 60K combos) expands. Answer with sharper value combos & B2B lunch, not deeper discount (already 32%).−₫0.9B/mo run-rate since Jan
Menu hygiene205 slow SKUs + duplicated POS names distort every ranking; consolidate, then re-rank by margin once cost-per-dish lands.2.7% of sales · 34% of menu
🌱 Develop
Drinks line (tea / matcha)Zero drink attach today; 29.6% of F&B operators rank matcha a top strategic bet and drinks are the industry's cash-flow keeper. ShopeeFood users skew drinks — where Cooky already has 68–71% of its orders.margin + basket, no new kitchen
Gà Nướng HN scale-up (evening)Runs at just ₫126M/mo vs ₫2.0B in HCM, yet has Hanoi's best attach (78%) and lowest discount (23%) — push evening whole-bird combos on the existing kitchens.HCM shows a ₫2B/mo ceiling
Family / occasion sizesĐùi Lớn (₫74K) and Gà Bó Xôi (₫374K) prove baskets stretch — add family portions to Cơm Sườn & Bento to lift AOV with recipes already proven.AOV lever, zero capex
Who plays the same game? — 5 model families around Cooky (delivery-first · multi-brand · small stores + central kitchen)
Dedicated GrabFood HCMC campaign; lock early terms with Xanh SM Ngon while commission is 17–20%. Target: no app >50% of GMV in 12 months.
27pt gap
Grab HCMC: market 50% vs Cooky 23%
3
Scale stores on the contribution playbook
Replicate the winning profile: low rent (₫8–20M) near office clusters. Central kitchen + HQ semi-fixed → new-store contribution flows straight to EBITDA.
~11 mo
payback per store (~$11K capex)
4
Double down on the winning brand per region
Gà Nướng HCMC +47% in 6 months (lowest discount) · Cơm Sườn Hanoi ₫1.9B/mo, +38% in 6 months — concentrate promos on one flagship per region (details in Brands & Dishes above).
1 flagship
per region
5
Commission-free revenue — B2B office lunch + own channel
Weekly lunch plans for companies near store clusters; Zalo mini-app for pre-order & pickup — move regulars off-app and start owning customer data.
2.2% → more
direct GMV today · 0% commission
6
Upgrade the report into a fundraising tool
Add what investors will ask: SSSG (old vs new stores), AOV by channel/brand, commission by channel, store cohorts + payback.
4 metrics
still missing for investors
Key sources — accessed July 2026 · market figures are press estimates; Cooky figures from the internal Jun 2026 report
💡 Drag the sliders to see how monthly EBITDA responds. Baseline = trailing 3-month average (consolidated) pulled straight from the report data — the monthly data refresh updates this page automatically.
GMV lost per 1pp of discount cut (0 = customers don't react)
Commission pp on GMV (+ = apps raise fees, − = shift to cheaper channels)
A new store ≈ the median store at 75% capacity
Presets:
EBITDA / month
$13.9K ₫361.5M
positive — operations self-funding
EBITDA margin
3.4%
baseline 3.4% · revenue $410.8K
Δ vs baseline
+$0
EBITDA ×1.00 vs baseline
EBITDA / year (×12)
$166.9K ₫4.3B
if held for all 12 months
Lever Impact — cumulative effect on monthly EBITDA
Discount 27.7% → 27.7%with GMV response -1.00%/pp
+$0₫0
Platform fees +0.0 ppcommission 10.6% → 10.6%
+$0₫0
+0 new storescontribution ≈ $1.6K/store/mo
+$0₫0
Total changeEBITDA $13.9K → $13.9K
+$0₫0
Assumptions: COGS 37.0% + Marketing 1.4% stay proportional to GMV; Salary $50.4K + G&A $31.3K fixed (semi-fixed);
a new store = the median store ($17.5K GMV, 11.9% contribution) at 75% capacity, net of its own rent + payroll, excluding any extra central-kitchen/HQ load;
GMV sensitivity applies symmetrically to discount cuts and increases. Static monthly model — built for comparing scenarios, not forecasting.
Sourcing
Suppliers & procurement
🛒
Coming soon
Sourcing
This section is a read-only dashboard. Data will be pushed in from the management Sheets on the same monthly refresh as the Financial Report — no data entry here.
Planned views
Supplier directory & payment terms
Top ingredients by spend
Material cost trend (ties to the P&L Material line)
Price changes month-over-month
Purchase order history
Inventory
Stock · par levels · waste
📦
Coming soon
Inventory
This section is a read-only dashboard. Data will be pushed in from the management Sheets on the same monthly refresh as the Financial Report — no data entry here.
Planned views
Stock levels per kitchen vs par level
Expiry & waste tracking
Stock counts and variance
Transfers between kitchens
Staffing
9 kitchens · HCMC · headcount & labour cost · Jun 2026
Month
AI ▼
Store Staffing Economics — best store first · bar = labour % vs Cooky 9-store averageJun 2026 · HCMC
49% of the HN Salary line (₫638.7M) · rest: central kitchen ₫135.4M + office ₫188.7M
Labour Cost
6.7% of GMV
HCMC 6.2% · delivery norm 8–12%
Store Headcount
103
11 full / 92 part · + central kitchen 8, office 9
Man-days
1,161
avg ₫271K per man-day
AI — labour 6.7% of GMV (HCMC 6.2%) · 4 stores ≥10% — but high labour ≠ weak store▼
Facts
Labour % — the four heavy stores vs the Hanoi average
Xã Đàn
11.9%
Trung Kính
11.1%
Phú Đô
10.8%
Dương Nội
10.6%
Hanoi average
6.7%
Payroll ÷ Jun GMV. All four are small-GMV kitchens — the ratio is a volume problem more than a headcount problem.
Labour % ≠ store health — read it with the margin
Trung Kính — labour 11.1%est. margin 11.0% ✓
Phú Đô — labour 10.8%est. margin 7.6%
Xã Đàn — labour 11.9%est. margin 5.7%
Dương Nội — labour 10.6%est. margin 0.7%
Trung Kính clears a healthy margin despite the ratio — its fix is the GMV dip (−30% MoM), not the roster. Xã Đàn & Dương Nội carry both problems at once.
Roster is already lean — the cost sits in the man-day
HCMC ₫/man-day
₫219K
Hanoi ₫/man-day
₫271K
Hanoi runs 11 full / 92 part (part-time-heavy — the mix HCMC is still working toward) yet pays +24% per man-day. The lever here is shift length & scheduling, not the full/part mix.
Suggestions
1
Fold the labour ratio into the Weak-Store Turnaround scoreboard — Xã Đàn & Dương Nội carry payroll + discount + volume problems at once; Phú Đô (10.8% · margin 7.6%) joins the watchlist.
2
Benchmark the ₫/man-day gap vs HCMC (+24%): audit shift lengths & overtime at the four heavy stores — closing half the gap ≈ +₫30M/mo across Hanoi.
3
Don’t touch Trung Kính’s roster — margin is healthy; the fix is the GMV dip (−30% MoM, see the store-visit routine), not the crew.
Payroll = Jun 2026 salary file · margins = est. store P&L (Stores page) · labour % = payroll ÷ Jun GMV
Store Staffing Economics — Hanoi — best store first · bar = labour % vs Hanoi average 6.7%Jun 2026 · Hanoi
Store
Staff
Full / Part
Man-days
Payroll
Revenue (GMV)
₫/man-day
Labour %
%
Linh Đàm
9
1 full / 8 part
110
₫23.9M
₫463.4M
₫217K
5.1%
Nghĩa Tân
11
1 full / 10 part
96
₫23.7M
₫455.2M
₫248K
5.2%
Lý Thường Kiệt
9
1 full / 8 part
106
₫32.6M
₫624.3M
₫309K
5.2%
Trần Đại Nghĩa
9
1 full / 8 part
100
₫24.5M
₫467.2M
₫244K
5.3%
Phùng Hưng
6
1 full / 5 part
82
₫23.1M
₫439.8M
₫281K
5.3%
Dương Khuê
6
1 full / 5 part
102
₫28.2M
₫490.4M
₫275K
5.7%
Khúc Thừa Dụ
8
0 full / 8 part
108
₫22.0M
₫337.7M
₫205K
6.5%
Giáp Nhất
6
0 full / 6 part
76
₫23.0M
₫330.5M
₫303K
7.0%
Đại Linh· fixed fee — no attendance sheet
0
0 full / 0 part
—
₫4.0M
₫48.2M
—
8.3%
Thái Hà
8
1 full / 7 part
90
₫23.1M
₫271.8M
₫258K
8.5%
Dương Nội· opened Jun — attendance incomplete
2
0 full / 2 part
20
₫11.7M
₫110.7M
₫590K
10.6%
Phú Đô
8
2 full / 6 part
85
₫19.2M
₫177.8M
₫225K
10.8%
Trung Kính
9
1 full / 8 part
93
₫29.7M
₫267.7M
₫319K
11.1%
Xã Đàn
12
1 full / 11 part
94
₫25.8M
₫216.4M
₫275K
11.9%
Payroll = actual fund incl. employer contributions (BẢNG LƯƠNG T6.2026, sheet TH.) — ties to the P&L HN Salary line to the đồng (₫638.7M). Revenue = Jun monthly close. Payroll names → dashboard names: Hoàn Kiếm→Lý Thường Kiệt · Cầu Giấy→Khúc Thừa Dụ · Lương Định Của→Xã Đàn · Thanh Xuân→Giáp Nhất · Minh Khai→Trần Đại Nghĩa · Ba Đình→Thái Hà (matched by planned fund ₫23.50M). Man-days: fulltime = công thực · part-time = hours ÷ 8. Green ≤6.5% · red ≥10%.
Channels
Channel mix & economics · from order data ·
Month
AI ▼📊 Market context — platform shares & what rivals pay · Jul 2026 research▼
Channel economics — every platform, one row: volume, what it costs, what reaches Cooky
AI ▼
Share bar = % of orders · Net = paid ÷ GMV (after discount, commission & VAT) · MoM = GMV vs previous month
Mix by city — GMV share per platform
AI ▼
Order size distribution — every order bucketed by value ·
AI ▼
Single-platform dependence — stores with the most eggs in one basket
AI ▼
% = share of the store’s orders on its biggest platform. High = fragile if that app changes ranking or fees.
Promotion
Campaigns · promo calendar · spend
🎯
Coming soon
Promotion
This section is a read-only dashboard. Data will be pushed in from the management Sheets on the same monthly refresh as the Financial Report — no data entry here.
Planned views
Active campaigns per platform
Promo calendar and budget vs spend
Discount funded by Cooky vs platform
Campaign performance (uplift vs margin cost)
Quality Control
Food safety · audits · incidents
✅
Coming soon
Quality Control
This section is a read-only dashboard. Data will be pushed in from the management Sheets on the same monthly refresh as the Financial Report — no data entry here.
Planned views
Hygiene & food-safety audit scores per kitchen
Incident log and resolution status
Licenses / permits and expiry dates
Customer complaint & rating trends
Competitive Benchmark
Cooky vs. SEA cloud-kitchen peers
Research · July 2026
Three Indonesian operators solving the same problem as us — food brands off shared kitchens, sold through delivery apps — each with a different playbook. Start with what each one actually is, then the head-to-head. Cooky = live from this dashboard (Jun 2026); peers = triangulated from press & investor filings.
🏢 Meet the players
One infographic per business — what they sell, how big, and whether the money works.
Cooky🇻🇳 UsPrivate · Ho Chi Minh City & Hanoi, Vietnam
Gà Nướng · grilled chicken
What they do — Vietnam's multi-brand cloud-kitchen operator. Builds and runs its own chicken, pork-chop-rice and value-rice brands out of 23 delivery kitchens across HCMC & Hanoi, sold mainly on GrabFood, ShopeeFood, BeFood & XanhNgon.
Hero brandsGà Nướng · grilled chickenCơm Sườn · com tamBento · rice combosĂn Ngon Rẻ · value
Revenue / GMV
₫10.6B/mo
~$4.9M/yr run-rate (gross)
Profitability
2.2%
EBITDA · thin · ~14% target
Funding
Private
undisclosed
Kitchens
23
2 cities
Brands
4
multi-brand house
Edge: blended platform commission ~10.6% vs 25–30% market · Growth: +32.6% H1'26 vs H1'25.
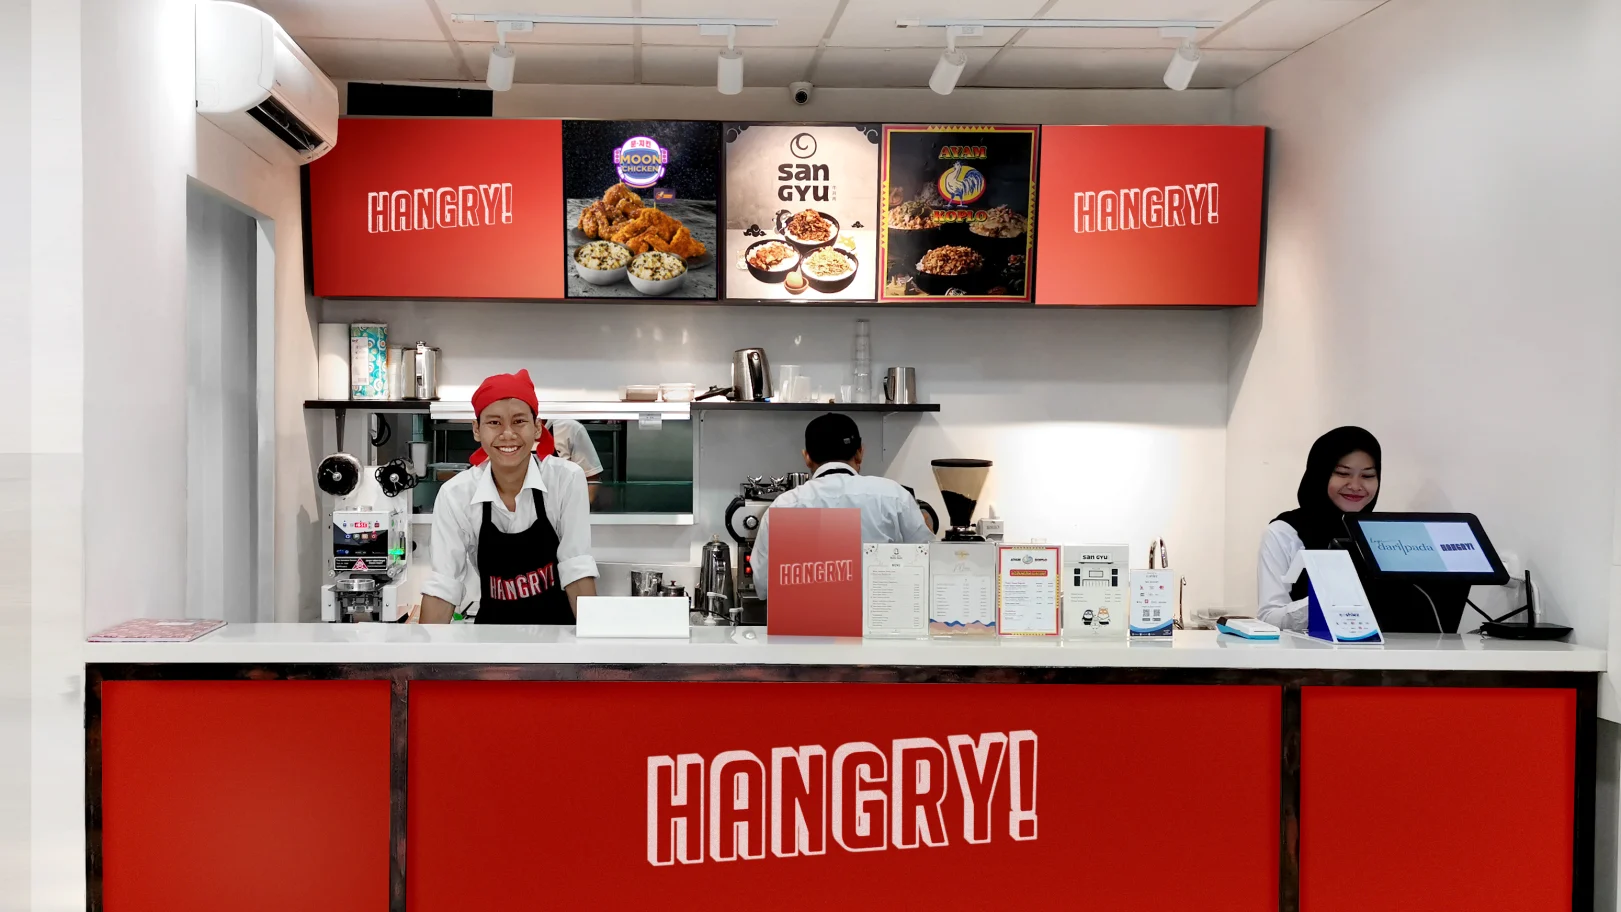
Hangry🇮🇩 BreadthPT Modular Kuliner · Jakarta · est. 2019
One counter · many brands
What they do — Indonesia's largest multi-brand "virtual restaurant" house. Designs and owns ~18 delivery-first brands (mostly fried chicken & value bowls), cooked in ~117 cloud kitchens and sold through its own app plus GoFood, GrabFood & ShopeeFood.
Hero brandsMoon Chicken · Korean FCSan Gyu · JP beef bowlAyam Koplo · geprekKopi Dari Pada · coffee
Revenue / GMV
n/d
1,000+ portions/outlet/day
Profitability
n/d
never disclosed
Funding
$48.5M
over ~6 yrs
Outlets
~117
2025
Brands
18
17 chicken + 1 bev
Backers: Alpha JWC, Sequoia/Surge, Journey Capital. Latest Series A5 $10.5M (Oct 2025) for kitchen-infra efficiency; eyeing Malaysia.
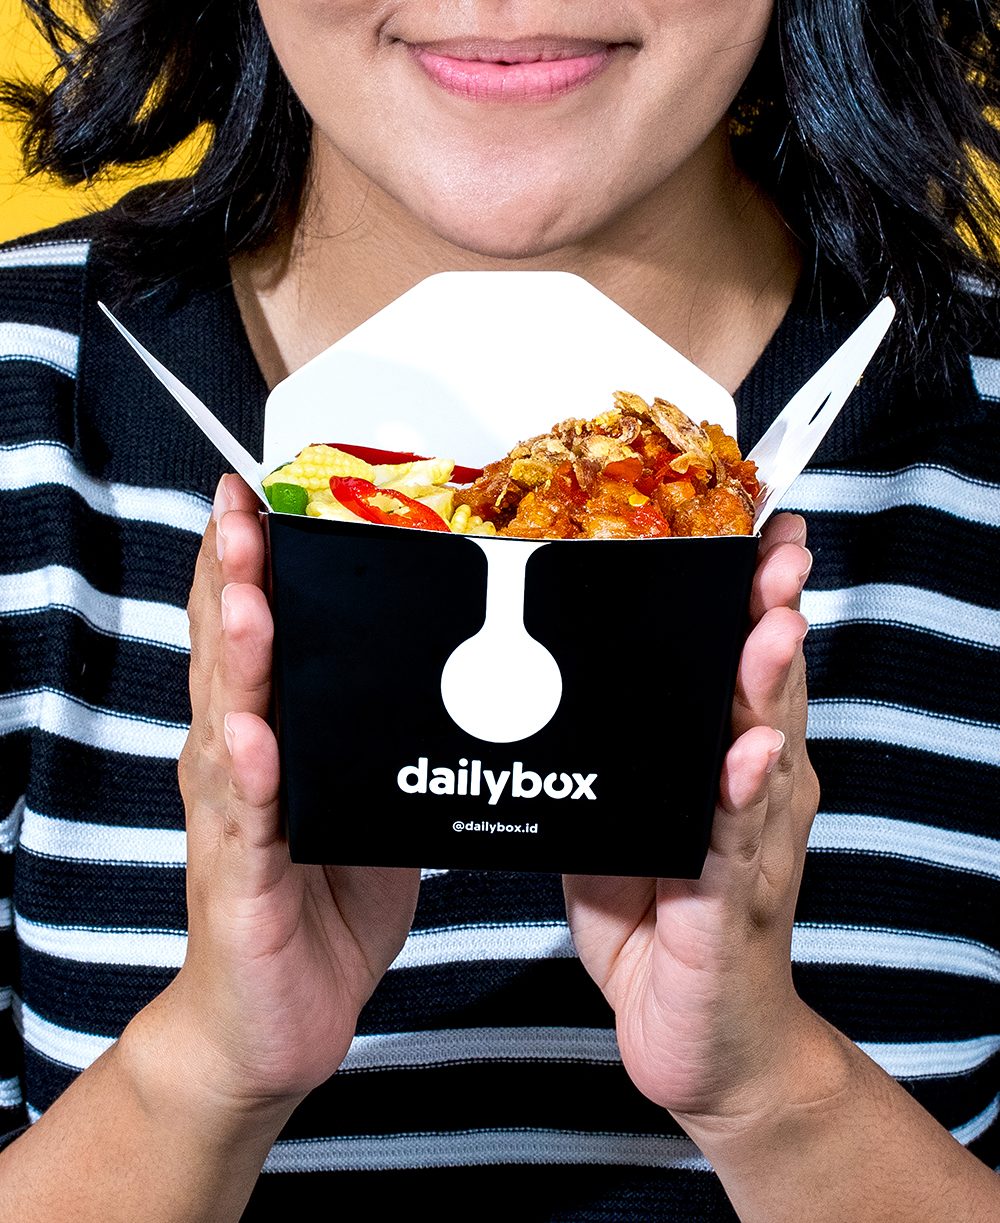
DailyCo (ex-Dailybox)🇮🇩 Roll-up + B2BDaily Group · Jakarta · est. 2018
Dailybox · rice box
What they do — Began as grab-and-go rice-box brand "Dailybox"; now an omnichannel multi-brand F&B group that also runs a large B2B catering arm and grows by buying majority stakes in other food brands. Sells via own app + GoFood/GrabFood and physical counters.
Backers: Vertex Ventures, Northstar, Kinesys. "Acquisition-feast" roll-up (bought Waku & YummyCorp in 2025); raising a new ≥$24M round.
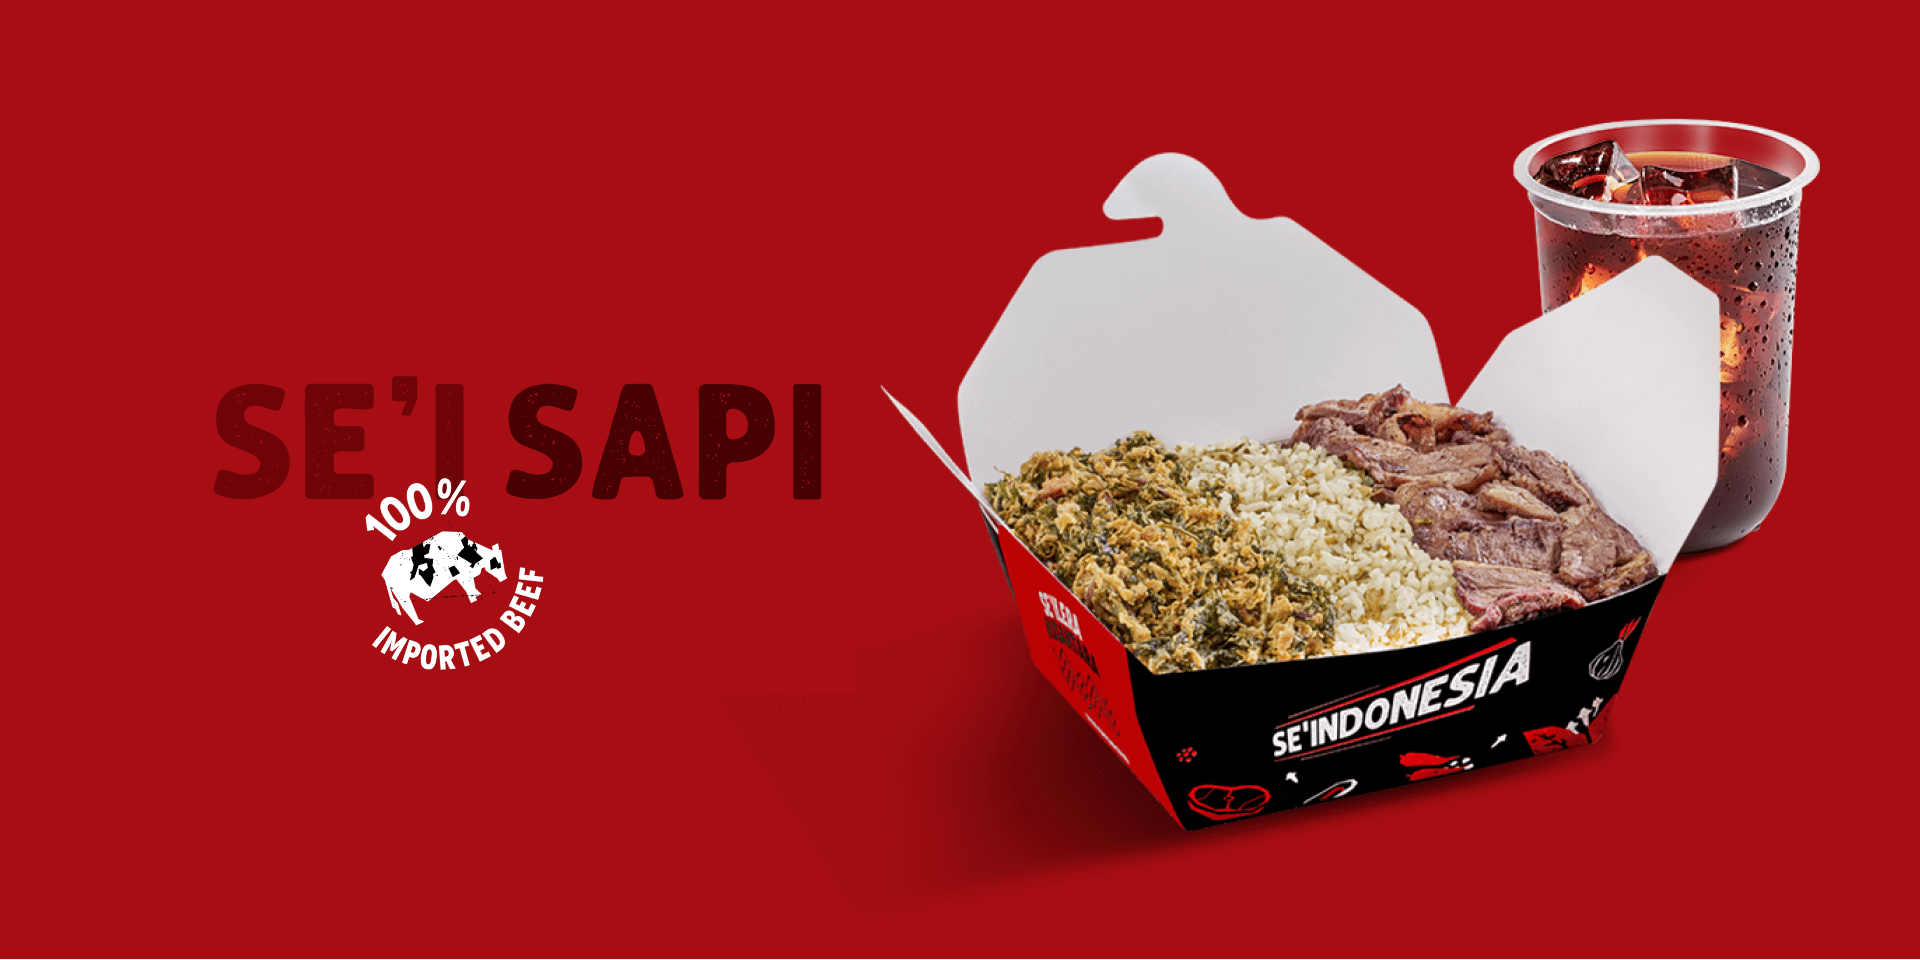
Se'Indonesia🇮🇩 Depth · $1 bowlPT Bangkit Lakuliner · Jakarta · est. 2021/22
Se'i Sapi · $1 beef bowl
What they do — A single-brand category creator built around one hero product: the ~$1 smoked-beef rice bowl ("se'i sapi"). A factory-scale central kitchen does ~90% of prep, feeding 200+ ultra-low-cost delivery outlets (plus ~23 dine-in). Sold only on GoFood/GrabFood/ShopeeFood — no own app.
A house of one — depth over proliferation. Product lines, not separate brands.
Product lines & formats
Se'i Sapi · beef bowlSe'i Ayam · chickenSambal Lu'atSe'i Bakar Madu · dine-in
Cooky4 brands · us
Focused multi-brand house — chicken, com tam & value rice.
Brands
Gà Nướng · grilled chickenCơm Sườn · com tamBento · rice combosĂn Ngon Rẻ · value
📊 Scale & money, head to head
Outlets / kitchenscount
Se'Indonesia
200+
DailyCo
200+
Hangry
~117
Cooky
23
Capital raisedUSD
Hangry
$48.5M
DailyCo
$24M+
Se'Indonesia
$9.7M
Cooky
private
Brands in the housecount
Hangry
18
DailyCo
12+
Cooky
4
Se'Indonesia
1
Capital efficiencyoutlets / $1M
Se'Indonesia
~21
DailyCo
~8.3
Hangry
~2.4
Cooky
n/a
📦 Monthly demand — latest
Cooky
102K
orders / mo
Jun 2026 · 23 kitchens
Hangry
n/d
not disclosed
capacity ~118K portions/day
DailyCo
~3M
meals / mo
~100K meals/day (group)
Se'Indonesia
~2M
meals / mo
as of Apr 2025
Peers count meals (individual items); Cooky counts orders (a basket ≈ 2–3 items) — so the gap in served items is smaller than the raw numbers suggest. Hangry never discloses volume; the figure shown is kitchen capacity, not actual throughput.
💰 Who's actually profitable
Cooky
2.2%
Thin
EBITDA Jun'26 · ~14% target
Hangry
?
Undisclosed
no figures ever public
DailyCo
~17%
Profitable
group EBITDA · no cash burn
Se'Indonesia
15mo
Profitable
straight · payback <9 mo
🧬 Business-model fingerprint
Cooky
Hangry
DailyCo
Se'Indonesia
Multi-brand portfolio
✓
✓
✓
✗single
Own ordering app
~tiny
✓
✓
✗
Factory central kitchen
~
~
~
✓~90% prep
B2B / diversified revenue
✗
✗
✓catering
✗
Profitable today
~thin
?
✓
✓
🎯 Where each one sits
Two winning corners: Se'I one-SKU depth · Hangry/DailyCo many-brand breadth
DailyCo / Dailybox — Vertex Ventures / Vertex Growth (Series B $24M; Apr'25 "acquisition feast": ~17% group EBITDA, no cash burn); TechNode / Asia Food Journal (Waku & YummyCorp M&A). Outlet count 200+ & ~$35M revenue are 2025 estimates.
Se'Indonesia (PT Bangkit Lakuliner) — Insignia Business Review (Series A $9.7M Apr'25; 15 mo profitable; <9-mo payback; 2–3M meals/mo); Forbes Asia "100 to Watch" 2025 (200+ delivery + ~23 dine-in, early 2026). Revenue/GMV & valuation not disclosed.
Brand portfolios & several data points cross-checked against anh's fact-checked research brief "F&B Startups in SEA" (July 2026), which verifies rounds/investors against Alpha JWC, Vertex, Insignia, Jakarta Post, DealStreetAsia & Forbes.
Peer figures triangulated from public press, investor announcements & databases (July 2026); "n/d" = not disclosed, "*" / "est." = third-party estimate. Peers report on different calendars — treat cross-company numbers as directional. Cooky figures are internal, current to Jun 2026.
Menu R&D
New-dish opportunities — chicken first
Analysis · July 2026
Chicken is Cooky's main ingredient — and already its #1 product. This page maps where the Vietnam chicken market is growing and which new dishes we can build off the kitchen & supply chain we already run, with GMV upside and trade-offs. Cooky figures live (Jun 2026); market figures from July 2026 research.
🍗 Chicken is already our backbone
Two chicken models already run at scale — a daily-meal rice line and an occasion whole-bird grill.
Top SKU system-wide
Cơm Gà Mắm Tỏi
₫705M / mo
17,504 orders · HCM (Bento)
Chicken item-sales
~₫5B
per month
Cơm Gà + Gà Nướng, both cities
Gà Nướng in Hanoi
₫82M
whitespace
vs ₫776M in HCM — 704 orders
Sauces already in kitchen
5+
grill & pan
mắm tỏi · muối ớt · tiêu đen · xối mỡ · sốt cay
Cơm Gà (Bento) — the volume engineitem-sales/mo
HCM
₫2.56B
Hanoi
₫1.82B
Gà Nướng (whole-bird) — HCM onlyitem-sales/mo
HCM
₫776M
Hanoi
₫82M
📊 The Vietnam chicken market
Chicken is the country's favourite fast food — and the fast-growing edge is Korean-style, delivery-native, exactly our lane.
Fried-chicken QSR revenue shareVietnam 2025
Jollibee
22%
Lotteria
21.5%
KFC
13.4%
Others
~43%
Chains are dine-in-led — the delivery lane (~90% ShopeeFood + GrabFood) is under-served.
🔥 The hot vector: Korean-style chicken
82% chose chicken in last fast-food buy~129 Korean-chicken outlets in VNChicken Plus 100→270 storesBHC entering (50/decade)Bonchon · Don Chicken · Papa's live
Korean sauces (spicy gochujang, cheese, honey-garlic, soy-garlic) are delivery-native and travel well — local brands are already bolting them on. Cơm gà base cost ₫20–25K → sells ₫35–50K.
🎯 Opportunities — in priority order
Ranked by certainty × fit with the kitchen and supply chain we already have. GMV = estimated incremental at maturity across 23 kitchens.
1
Deepen Cơm Gà + export Gà Nướng to Hanoi
Mass daily meal · already our #1 FIT: very high
₫0.95–1.4B / mo
Why it fits
Zero new equipment — same thighs, grill, pan & sauces. Gà Nướng is proven in HCM (₫776M) but near-zero in Hanoi (₫82M); Bento's Cơm Gà is the system's #1 SKU. Add Korean-sauce cơm gà + cơm gà xé variants on the existing line.
Trade-off
Menu clutter & internal cannibalisation if variants overlap. Mostly an expansion / rollout play (ties into P7 "HCM Hits → Hanoi") rather than true invention.
2
Xiên nướng (grilled skewers)
Hot snack / share · evening · Hanoi-first FIT: high
₫200–400M / mo
Why it fits
Grilled — no fryer needed, straight into our core skill and the same chicken supply (plus cheap add-ons: nem, xúc xích, veg). "Xiên bẩn" is exploding in Hanoi — exactly where our Gà Nướng is near-zero — with carts moving ~1,000 skewers/day. Customers buy 10+ at a time → a powerful basket-lift for our low ₫60K AOV. A central-kitchen, food-safe branded version answers the segment's #1 weakness (70–80% of street snacks fail E. coli tests).
Trade-off
Tiny ticket per skewer (₫2–15K on the street) — must sell as bundles / combos to be worth delivering; can't match street price, so win on hygiene + convenience, not price. Skewering is labour-heavy (pre-skewer & marinate centrally); grilled items need packaging that survives delivery.
3
Korean-sauce chicken (gà sốt Hàn)
Hottest growth segment · delivery-native FIT: medium
₫250–450M / mo
Why it fits
Rides the #1 trend the dine-in chains under-serve on delivery. Uses existing chicken thigh/wing; upside ₫600M+ if a SKU becomes a hero like Cơm Gà Mắm Tỏi. Pilot as "Korean sauce on grilled/pan thigh" to test demand before buying fryers.
Trade-off
A full fried line needs deep-fry capability (fryer capex, oil COGS, waste-oil handling, kitchen throughput). Chains discount heavily; some drift from Cooky's grill heritage.
4
Chicken wings (cánh gà sốt / chiên mắm)
Snack / share · evening daypart FIT: medium
+₫30–60M basket + orders
Why it fits
Cheap cut, strong add-on / basket-lift — Cooky's paid AOV is low (₫60K) and attach already high (87% HCM). Pairs naturally with the fryer from #2.
Trade-off
Also needs frying; small ticket on its own. Best run as an upsell rather than a standalone brand.
Parked — Gà ủ muối / hấp: piloted before; hard to build demand (couldn't find enough customers), so shelved. Comfort dayparts (cháo / bún / miến gà) remain untested backups if we want a lower-frequency, higher-margin line later.
⚖️ The core trade-off & sequence
Lead with the grill (what we're great at) before buying a fryer (what part of the trend needs)
Cooky's kitchen is built for grilling & pan-frying, so lead with the grill plays that need zero new equipment: #1 (deepen Cơm Gà & take Gà Nướng to Hanoi) and #2 xiên nướng — a food-safe, branded version of Hanoi's exploding "xiên bẩn" snack, in the very city where our grill is weakest. Only then weigh the fry plays — #3 Korean-sauce chicken (pilot as "Korean sauce on grilled thigh" first) and #4 wings — which need a deep-fry capability we don't run yet (fryer capex, oil COGS, waste-oil handling, throughput). Combined upside at maturity ≈ ₫1.4–2.3B/mo incremental GMV, and the top two need no capex. (Gà ủ muối was piloted and shelved — weak demand.)
Korean-chicken trend — SOSP Group ("82% chose chicken"), Retail News Asia (BHC Vietnam), Asia Food Beverages (Chicken Plus 100→270): ~129 Korean-chicken outlets in Vietnam, multiple chains expanding.
Delivery mix — VnExpress: ShopeeFood + GrabFood ~90% (Shopee leads Hanoi 56%, Grab leads HCM 50%). Cơm gà unit economics: base cost ₫20–25K, retail ₫35–50K.
Xiên nướng / "xiên bẩn" — VietnamNet ("nở rộ ở Hà Nội, khách vây kín"), Dân Việt / báo ngành: skewers ₫2–15K each, customers buy 10+, carts sell ~1,000/day (~₫150M/mo); 70–80% of street snacks near schools fail E. coli tests (food-safety gap = the branding opportunity).
GMV estimates are Cooky's — modelled from current chicken volumes, per-store rates and the HCM→Hanoi gap; treat as directional planning ranges, not forecasts.
Analysis prepared July 2026. Market figures are third-party; Cooky figures are internal and current to the latest closed month (Jun 2026). GMV ranges are planning estimates, not commitments.
Hangry & SE' Indo
What two Indonesian fried-chicken operators teach Cooky
Meeting · 24 Jul 2026
Portfolio meeting notes
Cooky · Hangry & SE' Indo
Two Indonesian fried-chicken giants, studied independently — and they landed on almost the same playbook. Here is what matters for Cooky, in pictures.
📅 24/07/2026✍️ Truc Tran🍗 Fried chicken · Indonesia
🍗
💡
The one idea
The moat is OPEX, not COGS. At scale, ingredient cost matches QSR — the real edge is operational simplicity + volume, which is what lets both peers discount hard online and still profit.
1
HANGRY
Indonesia · 20 brands
Standardised everything on fried chicken after early mistakes (mixed brands in one kitchen broke the "simple but large volume" rule). Now many brands ride one core product.
1 · PRODUCT
🍗
Taste good and meaningfully better than rivals. Every SKU needs a clear USP.
→
2 · DISTRIBUTION
🛵
Product + distribution alone scale a brand 0 → ~$50M before heavy brand spend.
→
3 · BRANDING
📣
Comes last — deployed only to highest-ROI channels (influencers, flagships).
🏷️
Brands
20
19 fried-chicken + 1 coffee. Top brand only 18% of revenue.
🚀
New brand cost
~$2K
Asymmetric upside — runs 40–50 projects at once.
📦
Orders / outlet
~1,000/day
Volume is the key lever — raise revenue per store.
💰
EBITDA
15–16%
Healthy enough to compete on price.
Per-outlet cost structure % of revenue
Labor
18.5% (?)
EBITDA
15–16%
Branding
~3%/mo
Rent
~1.5%
💵 Value pricing vs QSR
Hangry
$1–2.5
anchored ~$1
undercuts
QSR
$2.5–3
the main rival now
Local cloud-kitchen rivals have exited — the fight is now against QSR (McDonald's / KFC).
🏭
Kitchen footprint
~60m²
One standardised fried-chicken line. Setup capex ~$45K (incl. 1–2 yr deposit).
🎯
North star
~$500M
Indonesia revenue in 5 years, online-first. Malaysia store #1 in July.
🥫
Next lever
Sauce facility
No central kitchen yet — wants an in-house sauce plant to cut COGS.
👔
CEO lesson
CEO = Chief Product Officer
Handing product to others hurt — product must stay with the CEO.
2
SE' Indonesia
Central-factory · online-led
Launched 2023, scaled fast on a central factory / central kitchen model with lean cloud kitchens and aggressive online discounting. Preparing to franchise.
🏪
Outlets
250–270
Across cities (Surabaya, Bandung). ~4,000 staff, 500 at the factory.
📅
Launched
2023
"Selected menu" approach to speed scale.
🥩
Buying power
~$12M
Beef contract — 12-month deals lock input prices.
🍟
SKU rule
Centralise or skip
Avoids items that can't be centralised (even French fries).
🏗️ Cloud kitchen vs dine-in capex
Cloud kitchen
$7K
30–40m²
≈ 50×
Dine-in
$150K
a different model
📈 Dine-in lifts nearby online GMV
Before
$30K/mo
↗
1.5–3×
After dine-in
$45–50K/mo
Physical stores are a GMV lift, not the core revenue engine.
COMPANY
🏭
Runs the central factory — recipes, scale, economics.
+
FRANCHISEE
🧑🍳
Operates the stores. Model in progress — none launched yet.
→
ONE BRAND
⭐
Prefers scaling a single core brand (PMF + marketing focus). Eyeing SEA: Malaysia, Philippines.
💡
Takeaways for Cooky
both peers converged
Hangry and SE' Indonesia arrived at nearly the same playbook independently — that pattern is worth Cooky's attention.
🛡️Moat = OPEX, not COGS
Ingredient cost converges with QSR at scale. The edge is operational simplicity + volume → pricing power.
🎯One production flow
Add SKUs only if they fit the existing line. Pressure-test new items (da heo giòn, chân gà xả tắc): same flow as cơm sườn, or fragment the kitchen?
🏭Central kitchen = cost/consistency engine
Centralise what centralises well (sauces, marinades, par-cooked proteins) as the lever for margin.To discuss
📱Online-first, stores as GMV lift
SE' showed dine-in can 1.5–3× nearby online GMV; Hangry treats flagships as pure branding.To discuss
🤝Buying power stabilises inputs
Both lock 12-month supplier contracts once store count gives them volume.
🏷️Single vs multi-brand tension
SE' prefers one brand; Hangry runs 20 — but all on one fried-chicken line. Lesson: multiply brands, not production lines.
⭐
Sharpest single takeaway
Cooky should treat operational simplicity + centralised production as the strategy — not a back-office detail — because that is what unlocks the pricing power both peers rely on.
Source: Notion meeting note "Cooky | Hangry & SE' Indo" (24 Jul 2026, by Truc Tran). Figures are as reported by the two operators; treat as directional context, not verified financials.